
In Part 1 of this blog I talked about the ways in which the back-end layer can be optimized to get the better performance.
In this part, I will discuss the front-end points that can be used to optimize the loading time of Qlik dashboard and to improve the performance.
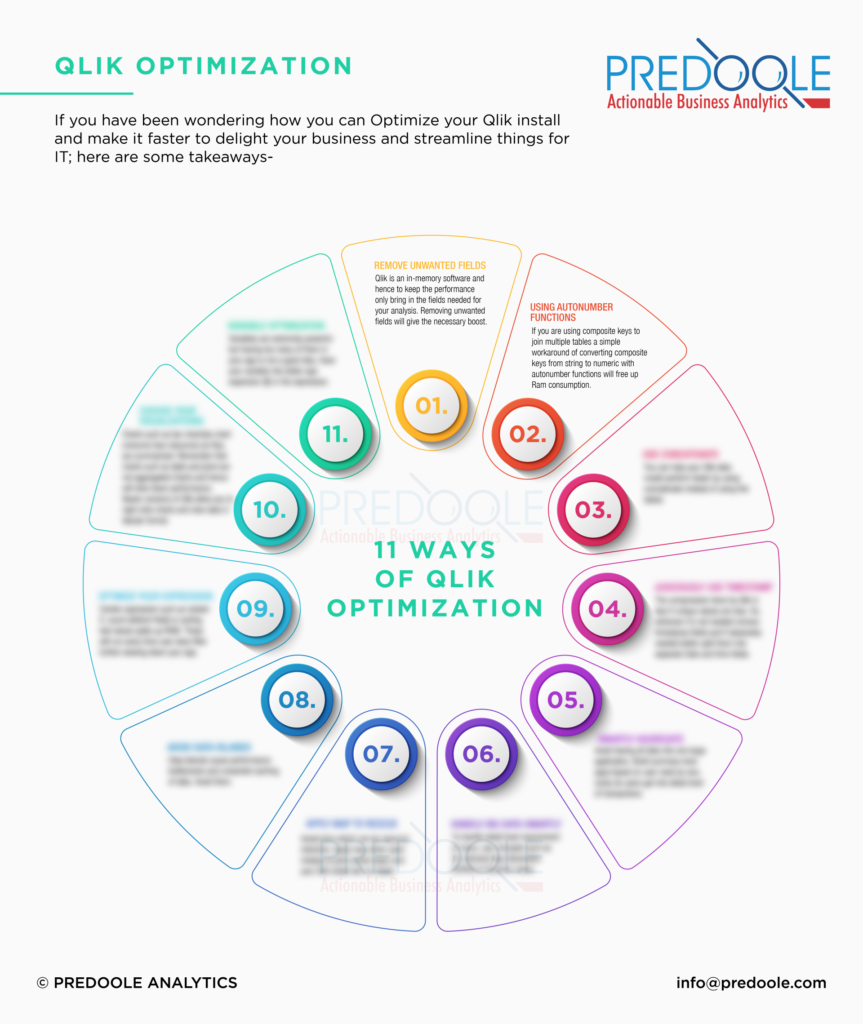
Categorizing the performance improvement points into broad segments.
Expression optimization
When we open a dashboard or when we move from one sheet to another, the available charts on that sheet start evaluating the expressions. So, if you have heavy expressions in charts it may take long time to open the chart which results in the performance issues, Hence it is important to optimize the expressions of charts for better user experience.
Let us look at some of the expressions that should be avoided to improve the performance.
- Count (Distinct Field)
- Count (KeyField)
- Sum (If else condition)
- Nested IF statements
- If (Condition on Text)
- Sorting text values
All the above expressions utilize high amount of CPU while evaluating. With large amount of data these functions can exceed the maximum calculation time and may not even work.
You can go through below link for more details. The link is for QlikView but it is also applicable to Qlik Sense.
Visualization optimization
Visualizations with aggregated results give better performance. Below are some of the charts you should avoid with large data sets.
- Table Chart
- Pivot Chart
- Text Object with Expressions
The Table and Pivot charts are mostly used to show the multidimensional data, where there are multiple dimensions and/or multiple expressions required.
When these visualizations contain large amount of data as well as columns, they consume high CPU and RAM. Thus, it is recommended to avoid them when large amount of data is used in dashboard.
If you still want to use these charts, then you should restrict the chart rendering by enabling the calculation conditions. This way you can restrict the data shown on these charts and speed up the rendering of the charts improving performance.
Complex calculation optimization
Often, we write complex calculations in charts expression or in the calculated dimensions to achieve some kind of functionality; for example creating buckets, if else statements or some kind of flags to filter data.
The problem with this approach is that Qlik starts evaluating every expression available in charts on a sheet when there is any change in the filtering.
Meaning, if you make selection in any of the field or you deselect a value, the expressions will start calculating again, which may cause performance issue if the calculation is complex.
For getting better performance it is recommended that what ever complex calculation we want on charts either as expressions or as calculated dimensions should be moved to either ETL layer or in dashboard scripting while creating data model.
Doing this will ease the calculation and improve the time required for evaluating the expression, which will eventually improve the overall performance of the dashboard.
Variable optimization
Many a times we use variables in the dashboard to reuse certain calculations or to filter the data dynamically, but when we do this, we need to keep the basic working of the variable in mind to get better performance.
Usually when we declare the variable we put the equal to sign (‘=’) before starting of the expression, so that the expression evaluates. In this case, the variable will evaluate whenever we make any selection in the filed or deselect any value from the field. This puts a burden on the resources and decreases the performance.
Also having large number of variables has impact on the performance. Hence it is recommended that we use limited numbers of variables in the dashboard and also try to avoid putting equal to sign while storing the heavy calculations in variable.
In such cases you can refer the variable into dollar sign expansion ($) in the expression. This way you can restrict the recalculation of the variable on selection.
More Resources
You can go through below link for more information on Optimizing Qlik Performance.
Hope these performance optimization points improve the user experience for your dashboards. If you have any questions or suggestions feel free to drop me a note