
QlikView and Qlik Sense are very versatile platforms and enable agile implementations. Any department or even individual can start developing on their own and provide value to their organization. This is how most Qlik implementations have started and grown. However, over a period the installs grow with more dashboards, more users, and more data. Now things start slowing down and breaking up and IT is held responsible for making it better.
This is the background for this writing…….
What is this article about?
For IT to drive Enterprise wide adoption of Qlik BI, it is essential to have an optimized install that provides reliable data on time and fast response to users in all formats of devices. How do we go about Optimizing Qlik Installs for Enterprise grade SLA?
Who can benefit from it?
Qlik Developers and IT Managers looking to fix Qlik performance issues.
Technically savvy business users who face performance challenges with Qlik and can point potential solutions.
To start with, Understand and Discover your Environment
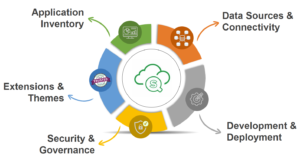
Identify the biggest culprits – typically large applications with large number of users using large RAM. Discovering the department wise count of applications, size of each application, number of users for each, current hardware CPU and RAM available. Also make note of your licensing – whether it is user based or core based.
The optimization techniques used for back-end layer will help you reduce the RAM footprint required for the data model. We all know that Qlik Sense is an in-memory tool, so more the RAM required by the dashboard more the time required to process it, in general. Thus, it is important to reduce the RAM footprint of the dashboard.
Tactics to reduce the RAM footprint:
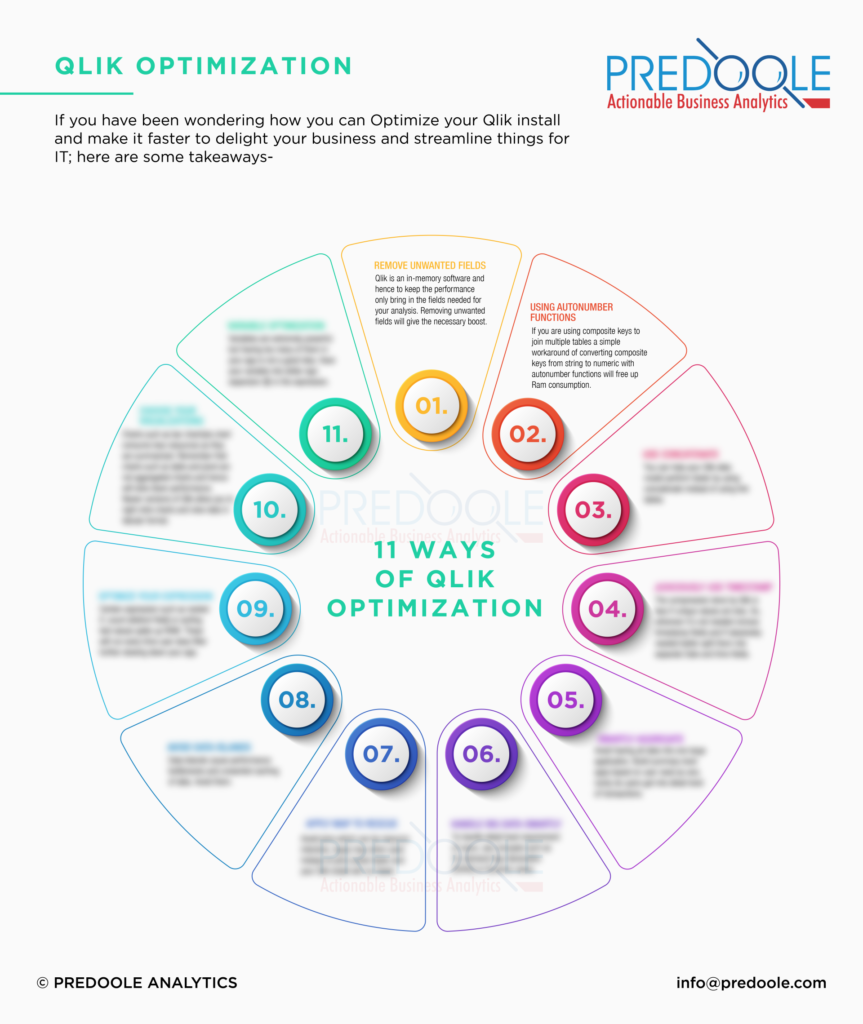
1. Remove unwanted fields
Often we write “Select * from ” or “Load * from” while loading the data in Qlik Sense. We do this purposefully because we think those fields may be required in future, but we forget that those unwanted fields will increase the RAM required by the dashboard and may increase the size of the dashboard.
2. Use Autonumber functions to convert Composite keys to number
We mostly create composite keys while linking two or more tables that have multiple common fields. Composite keys help in avoiding the synthetic tables from the data model. As a developer we must know that composite keys are stored in RAM as string data type. And string data type requires more RAM as compared to numeric data type. Also, we do not use the composite keys in any calculation.
Thus, it is important to convert the composite keys into numeric keys using Autonumber functions. Doing this will save some amount of RAM footprint from dashboard.
Check this Qlik community article for more details about Autonumber.
https://community.qlik.com/t5/Qlik-Design-Blog/Autonumber-function/bc-p/1464973
3. Avoid Link table for large data model and use Concatenate
When we create Link tables to join multiple tables, they act as a large fact table. Fact tables mostly contain the keys which are unique in nature. So, link table with huge data will result in unique data and will unnecessarily increase the RAM footprint.
In such cases you can use the concatenate option to combine large tables into a single table and use it.
4. Remove Timestamp from data
Qlik compresses the data based on the unique values available in the field. So less unique values result in more compression and less RAM required.
Timestamp data is the most non unique data, which when used in data model increases the RAM requirement of the data model. If you do not require timestamp fields, it is always good to remove them. If you require them, you can split them into Date and Time, which will reduce the uniqueness and it will improve performance.
5. Aggregate data when summary is required
Mostly when a dashboard audience is top management their interest lies in seeing the summary of the data. But when we create dashboard, we load raw data and summarize that on frontend. In this approach we load unnecessary details of the data, which eventually increases the size of the application.
It is strongly recommended that you summarize the data using group by function while loading the data for dashboard.
6. Use ODAG and Dynamic Views for big data use cases
When dealing with huge/big data in Qlik Sense, it is recommended to implement ODAG methodology. In ODAG single huge Qlik sense application is divided into two applications namely summary and detailed application.
ODAG summary application includes only the most frequently needed summary data into dashboard. Users who want to see the detailed transactional data can create detailed application on demand. This way only required data is moved to RAM and overall performance gets improved.
You can check this video for understanding how to implement ODAG in Qlik Sense.
Similar way you can use the Dynamic Views, that allows you to dynamically change the data on a click of a button. Good part about this is, you do not need to update entire dashboard, you can get the latest data for selected charts on your dashboard. It helps to get the latest data very quickly.
You can also go through below video for understanding how Dynamic View works.
7. Replace joins with Apply map
Joins are known to be resource intensive function in Qlik Sense. When used improperly it may cause high usage of primary RAM. Also, at times, if the joining table contains duplicate records, it may increase the total number of rows, which results in incorrect values.
It is a good practice to replace the join with applymap functions. Applymap function is faster than joins and avoids the chance of increasing the rows.
For detailed information checkout this community post.
https://community.qlik.com/t5/Qlik-Design-Blog/Don-t-join-use-Applymap-instead/ba-p/1467592
8. Avoid text fields for joining tables
As a best practice it is recommended to use only numeric fields for linking or associating multiple tables together. When text fields are used for joining tables it tends to decrease the performance of the dashboard.
9. Avoid Data island for large data models
We use the data island to achieve some functionality, but not many of us know that data islands should be avoided in large data models, because of the reason that every selection in the data island field, refreshes entire dashboard again, which results into unnecessary caching of the data.
Checkout this detailed information on Data Island by Rob Wunderlich. The article is older but remains true for Qlik Sense.
Conclusion
As developers, we are always under pressure to deliver analytics faster. In the process of doing this we usually keep the performance tuning points at the end of the development. But as a best practice, we should keep performance improvement factors in mind while designing and developing the dashboard. Dashboards designed with best practices provide optimum performance to the end users which eventually help in increasing the usage and adoption of the dashboard.
Hope this blog gives an overview of the performance optimization of Qlik dashboards. If you have any questions or suggestions feel free to drop me a note
Stay tuned for second part of this blog, where I will write on front-end layer performance improvement. Until then share any experiences you have and subscribe below to stay tuned!
“Download these 11 ways of Qlik Optimization” for quick reference